
Understanding wage differences across the United States is crucial for job seekers, employees, and policy analysts. The latest wage map for 2025 reveals variations in average hourly pay across all U.S. states, highlighting trends in income, cost of living, and labor market demand. This comprehensive comparison helps workers make informed career decisions and understand regional economic disparities.
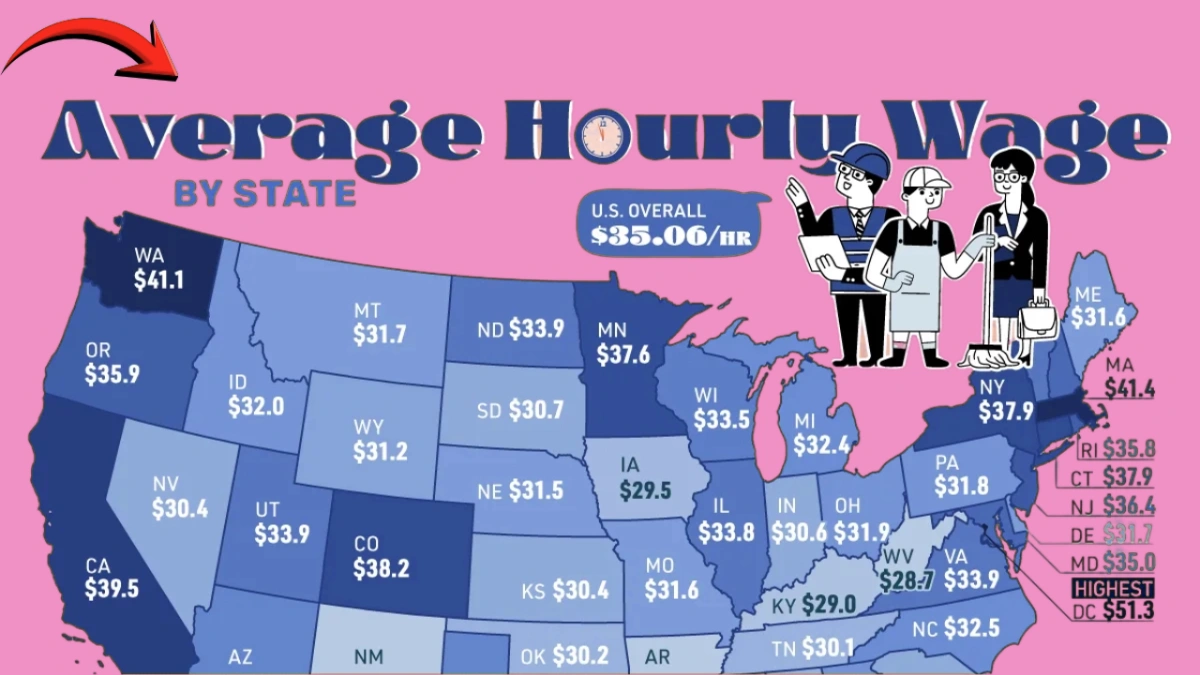
Average Hourly Pay by State
| State | Average Hourly Pay ($) | Notes |
|---|---|---|
| California | 34.50 | High cost of living, strong tech and service sectors |
| New York | 33.20 | Financial hubs, healthcare, and IT industries |
| Massachusetts | 32.80 | Skilled labor, education, and healthcare dominant |
| Texas | 28.50 | Growing energy and tech sector, moderate living costs |
| Florida | 27.80 | Tourism and healthcare drive wages |
| Ohio | 25.70 | Manufacturing and service sectors influence pay |
| Mississippi | 21.50 | Lower wages due to cost of living and industrial mix |
| Other States | Varies from $22–$31 | Regional economic conditions, labor supply, and demand |
Note: All figures are approximate average hourly pay rates as of 2025, rounded for simplicity.

Why Hourly Wages Differ Across States
Several factors contribute to wage variations across the U.S.:
- Cost of Living: States with higher housing, transportation, and food costs generally have higher wages.
- Industry Composition: Tech, finance, healthcare, and energy sectors typically offer higher pay.
- Labor Supply and Demand: States with labor shortages in specialized roles see wage increases.
- Minimum Wage Laws: States with higher minimum wages influence overall average pay.
- Unionization and Labor Rights: Stronger unions can boost hourly wages in certain regions.
Understanding these factors is essential for employees seeking the best opportunities and for policymakers analyzing economic disparities.

Top-Paying States for Hourly Wages
- California: Highest wages due to tech, entertainment, and finance hubs.
- New York: Financial services and corporate sectors drive pay rates.
- Massachusetts: Education, healthcare, and biotech industries provide competitive wages.
- Washington & Colorado: Tech and energy industries push hourly pay above the national average.
Lowest-Paying States
- Mississippi and Arkansas: Lower industrial mix and lower cost of living contribute to smaller paychecks.
- West Virginia & Kentucky: Traditional manufacturing sectors with lower wage scales.
- Alabama and Louisiana: Service and agriculture sectors influence lower average hourly pay.
Tips for Job Seekers Using Wage Data
- Consider both wages and cost of living when evaluating relocation options.
- Target industries and states where your skills are in high demand for better pay.
- Use wage maps to negotiate salaries with potential employers.
- Explore states with incentives, tax benefits, or lower living expenses for net advantage.
Why This Data Matters
- Helps employees make informed career and relocation choices.
- Guides policymakers in economic planning and minimum wage policies.
- Supports employers in competitive salary benchmarking.
- Highlights regional income disparities that may require targeted interventions.
Conclusion
The updated wage map of 2025 provides valuable insights into average hourly pay across all U.S. states. High-paying states like California, New York, and Massachusetts contrast with lower-paying regions such as Mississippi and West Virginia, reflecting economic, industrial, and demographic differences. Job seekers, employers, and policymakers can leverage this information to make strategic decisions, improve income opportunities, and address regional wage disparities.
Description
Compare average hourly wages across all U.S. states in 2025. Discover top-paying regions, lowest-paying states, and tips for job seekers and employers.
